Making better tables

analysis
Published

May 30, 2021

Note

I now have an updated version of this post. You can find it here.

There’s not much that’s sexy about a table. Everyone loves a good figure, but you won’t find many people singing the praises of a particularly well-constructed table in an academic paper. And yet, tables are the most common medium through which academic authors summarize datasets and relay results.

So why don’t tables get any love? Maybe it’s because they usually aren’t that interesting. Jammed full of dry, difficult-to-process numbers conveying a range of different types of information (means, standard deviations, parameter estimates, goodness-of-fit numbers, and so on), it’s no wonder that the average reader, myself included, is more inclined to skip over the tables to get to the more fun and illustrative visual displays in the paper.

But I don’t think it has to be this way. Or, at least, I think we can do better. The goal of this post is to write up my current best practices for generating the two main types of tables I use: data summary tables and regression tables. I’ll include the R code to generate the tables and the TeX code to include them in the paper, since although I try to avoid writing in TeX as much as possible, it’s still the best option for creating elegant, consistently formatted manuscripts.

General approach

Several guidelines steer my general approach.

  1. Automate the table generation process. The idea here is that I should be able to regenerate the table without any “manual” input to the greatest extent possible. This means that the could shoul d everything relating to table formatting.

  2. Use booktabs because it’s better. As with any form of data presentation, the best-designed tables are as simple as possible. As argued here by Nick Higham, vertical lines and double horizontal lines have no place in tables. The focus should be on the information, not the stuff around it.

  3. Captions and notes are part of the text. I find that I prefer to keep captions and notes separate from the table generation process. Writing and improving these pieces of text are closer to the writing process for me, and going back to the table generation code to edit captions or notes is a chore.

Generating data summary tables in R

Also known as summary statistics, or descriptive statistics, data summary tables deliver summarizing information about the variables used in analyses.

We’ll use the Fatalities dataset from the AER package as our sample dataset. This is a panel dataset with around 30 variables relating to traffic fatalities in the United States. First, we’ll do some quick setup, load the data, and preview it using glimpse (a much more useful alternative to head, in my view).

pacman::p_load(tidyverse, kableExtra, AER)

# Load fatalities panel data
data("Fatalities")
glimpse(Fatalities)
Rows: 336
Columns: 34
$ state        <fct> al, al, al, al, al, al, al, az, az, az, az, az, az, az, a…
$ year         <fct> 1982, 1983, 1984, 1985, 1986, 1987, 1988, 1982, 1983, 198…
$ spirits      <dbl> 1.37, 1.36, 1.32, 1.28, 1.23, 1.18, 1.17, 1.97, 1.90, 2.1…
$ unemp        <dbl> 14.4, 13.7, 11.1, 8.9, 9.8, 7.8, 7.2, 9.9, 9.1, 5.0, 6.5,…
$ income       <dbl> 10544.15, 10732.80, 11108.79, 11332.63, 11661.51, 11944.0…
$ emppop       <dbl> 50.69204, 52.14703, 54.16809, 55.27114, 56.51450, 57.5098…
$ beertax      <dbl> 1.53937948, 1.78899074, 1.71428561, 1.65254235, 1.6099070…
$ baptist      <dbl> 30.3557, 30.3336, 30.3115, 30.2895, 30.2674, 30.2453, 30.…
$ mormon       <dbl> 0.32829, 0.34341, 0.35924, 0.37579, 0.39311, 0.41123, 0.4…
$ drinkage     <dbl> 19.00, 19.00, 19.00, 19.67, 21.00, 21.00, 21.00, 19.00, 1…
$ dry          <dbl> 25.0063, 22.9942, 24.0426, 23.6339, 23.4647, 23.7924, 23.…
$ youngdrivers <dbl> 0.211572, 0.210768, 0.211484, 0.211140, 0.213400, 0.21552…
$ miles        <dbl> 7233.887, 7836.348, 8262.990, 8726.917, 8952.854, 9166.30…
$ breath       <fct> no, no, no, no, no, no, no, no, no, no, no, no, no, no, n…
$ jail         <fct> no, no, no, no, no, no, no, yes, yes, yes, yes, yes, yes,…
$ service      <fct> no, no, no, no, no, no, no, yes, yes, yes, yes, yes, yes,…
$ fatal        <int> 839, 930, 932, 882, 1081, 1110, 1023, 724, 675, 869, 893,…
$ nfatal       <int> 146, 154, 165, 146, 172, 181, 139, 131, 112, 149, 150, 17…
$ sfatal       <int> 99, 98, 94, 98, 119, 114, 89, 76, 60, 81, 75, 85, 87, 67,…
$ fatal1517    <int> 53, 71, 49, 66, 82, 94, 66, 40, 40, 51, 48, 72, 50, 54, 3…
$ nfatal1517   <int> 9, 8, 7, 9, 10, 11, 8, 7, 7, 8, 11, 19, 16, 14, 5, 2, 2, …
$ fatal1820    <int> 99, 108, 103, 100, 120, 127, 105, 81, 83, 118, 100, 104, …
$ nfatal1820   <int> 34, 26, 25, 23, 23, 31, 24, 16, 19, 34, 26, 30, 25, 14, 2…
$ fatal2124    <int> 120, 124, 118, 114, 119, 138, 123, 96, 80, 123, 121, 130,…
$ nfatal2124   <int> 32, 35, 34, 45, 29, 30, 25, 36, 17, 33, 30, 25, 34, 31, 1…
$ afatal       <dbl> 309.438, 341.834, 304.872, 276.742, 360.716, 368.421, 298…
$ pop          <dbl> 3942002, 3960008, 3988992, 4021008, 4049994, 4082999, 410…
$ pop1517      <dbl> 208999.6, 202000.1, 197000.0, 194999.7, 203999.9, 204999.…
$ pop1820      <dbl> 221553.4, 219125.5, 216724.1, 214349.0, 212000.0, 208998.…
$ pop2124      <dbl> 290000.1, 290000.2, 288000.2, 284000.3, 263000.3, 258999.…
$ milestot     <dbl> 28516, 31032, 32961, 35091, 36259, 37426, 39684, 19729, 1…
$ unempus      <dbl> 9.7, 9.6, 7.5, 7.2, 7.0, 6.2, 5.5, 9.7, 9.6, 7.5, 7.2, 7.…
$ emppopus     <dbl> 57.8, 57.9, 59.5, 60.1, 60.7, 61.5, 62.3, 57.8, 57.9, 59.…
$ gsp          <dbl> -0.022124760, 0.046558253, 0.062797837, 0.027489973, 0.03…
That’s a lot of variables! But we’re not going to summarize all of them. Suppose we think the main drivers of traffic fatalities in a state are the price of beer, how much people make, how much people drive, and how many people live there. If those are the variables we’re focused on, we might want to give the reader a sense for their distributions to help contextualize the remainder of the paper. That’s really the goal of a good summary statistics table: to provide context.

There are some great tools that will generate summaries for you (my favorite is modelsummary::datasummary), but I find that most of the time I prefer to build them by hand. function.] This gives me a clearer sense for what is in the data, and ensures that I don’t get lazy and just generate some default set of statistics, since those are not terribly informative or easy to read.

data <- Fatalities %>% ## Rescale variables
    mutate(beertax = beertax * 100,
           income = income / 1000,
           miles = miles / 1000,
           fatal = fatal / 1000,
           pop = pop / 100000) 

summary <- data %>%
    select(State = state, 
           Year = year, 
           `Unemployment rate` = unemp, 
           Income = income, 
           `Beer tax (cents)` = beertax, 
           `Miles per driver (1000s)` = miles, 
           `Vehicle fatalities (1000s)` = fatal, 
           `Population (m)` = pop) %>%
    pivot_longer(-c(State, Year)) %>%
    group_by(` ` = name) %>% 
    summarize(Mean = mean(value), 
              Median = median(value), 
              P5 = quantile(value, p = 0.05), 
              P95 = quantile(value, p = 0.95))
summary
# A tibble: 6 × 5
  ` `                          Mean Median     P5    P95
  <chr>                       <dbl>  <dbl>  <dbl>  <dbl>
1 Beer tax (cents)           51.3   35.3    9.47  162.  
2 Income                     13.9   13.8   10.8    18.1 
3 Miles per driver (1000s)    7.89   7.80   6.08    9.69
4 Population (m)             49.3   33.1    6.20  164.  
5 Unemployment rate           7.35   7      3.80   11.8 
6 Vehicle fatalities (1000s)  0.929  0.701  0.116   2.83

If you’re familiar with the tidyverse this code will be fairly intuitive. I rescale the variables so that they display well with the same number of digits1, select the variables I want to display, pivot the data into a long format, and finally summarize all of the variables using the same summary functions. I like re-labeling both the variables and the summary functions here to their final, human-readable versions that I’ll use in the table, since it reduces redundancy and extra typing.

The final step is to actually save the TeX output. kableExtra::kbl does basically all of the work for us here.

kbl(summary, 
    format = "latex", 
    linesep = "",
    digits = 1, 
    booktabs = T) %>%
    print()

\begin{tabular}[t]{lrrrr}
\toprule
  & Mean & Median & P5 & P95\\
\midrule
Beer tax (cents) & 51.3 & 35.3 & 9.5 & 162.1\\
Income & 13.9 & 13.8 & 10.8 & 18.1\\
Miles per driver (1000s) & 7.9 & 7.8 & 6.1 & 9.7\\
Population (m) & 49.3 & 33.1 & 6.2 & 164.5\\
Unemployment rate & 7.3 & 7.0 & 3.8 & 11.8\\
Vehicle fatalities (1000s) & 0.9 & 0.7 & 0.1 & 2.8\\
\bottomrule
\end{tabular}

I use print() to display the output here, but normally I would write this to a file using %>% write("summary.tex"), which would give us this TeX code in a file that we can load using our main document. But before we do that, we have one more task…

Generating regression tables in R

That’s right, it’s time to regress!! Linear regression is most economists’ analytic weapon of choice, including mine. I like the fixest package for many reasons, but for our purposes today the most salient one is that it includes a very nice table-making function called etable (again, for a very good alternative see modelsummary, especially if you want to make HTML tables).

First, let’s estimate a few models.

library(fixest)
models <- list()
models[["OLS"]] <- feols(fatal ~ unemp + income + beertax + miles, data = data)
models[["+ State FE"]] <- feols(fatal ~ unemp + income + beertax + miles | state, data = data)
models[["+ Year FE"]] <- feols(fatal ~ unemp + income + beertax + miles | state + year, data = data)

Here we’ve estimated three models that vary only in their included fixed effects. The first model, “OLS”, includes only the covariates. The second and third add state and year fixed effects, respectively. This kind of buildup table shows how the parameter estimates change as we condition on more covariates (which are just the additional fixed effects here). For the record, this is just a demonstration exercise; I wouldn’t interpret any of these coefficients as very likely to represent their true “causal” analogues. To show the results, I’ll use the etable function.

dict_names <- c("fatal" = "Vehicle fatalities (1000s)",
                "unemp" = "Unemployment rate",
                "income" = "Income",
                "beertax" = "Beer tax (cents)",
                "miles" = "Miles per driver (1000s)",
                "pop" = "Population (m)",
                "state" = "State",
                "year" = "Year")

etable(models,
       cluster = "state",
       dict = dict_names,
       drop = "Intercept",
       digits = "r2",
       digits.stats = 2,
       fitstat = c("n", "war2"),
       style.tex = style.tex("aer",
                             fixef.suffix = " FEs",
                             fixef.where = "var",
                             yesNo = c("Yes", "No")),
       tex = T) %>%
    print()
\begingroup
\centering
\begin{tabular}{lccc}
   \toprule
    & \multicolumn{3}{c}{Vehicle fatalities (1000s)}\\
                            & (1)          & (2)           & (3)\\  
   \midrule 
   Constant                 & -3.40$^{**}$ &               &   \\   
                            & (1.65)       &               &   \\   
   Unemployment rate        & 0.14$^{***}$ & -0.02$^{***}$ & -0.03$^{***}$\\   
                            & (0.05)       & (0.01)        & (0.01)\\   
   Income                   & 0.22$^{**}$  & 0.02          & 0.04$^{*}$\\   
                            & (0.09)       & (0.01)        & (0.02)\\   
   Beer tax (cents)         & 0.00$^{***}$ & 0.00$^{**}$   & 0.00$^{*}$\\   
                            & (0.00)       & (0.00)        & (0.00)\\   
   Miles per driver (1000s) & -0.01        & 0.00          & 0.00\\   
                            & (0.05)       & (0.00)        & (0.00)\\   
    \\
   State FEs                & No           & Yes           & Yes\\  
   Year FEs                 & No           & No            & Yes\\  
    \\
   Observations             & 336          & 336           & 336\\  
   Within Adjusted R$^2$    &              & 0.25          & 0.24\\  
   \bottomrule
\end{tabular}
\par\endgroup

Note that we used the dict_names character vector to define character labels. This unfortunately does repeat some code from earlier (and could have been avoided if I had been a bit more clever), but it’s such an elegant want to handle labeling that I wanted to highlight how it’s used in etable. Note also that rather than using a booktabs argument, the style.tex argument is doing the heavy lifting on the design side. You can review the etable documentation for more, but basically I’m asking it to follow the general American Economic Review (AER) format, which happens to include booktabs-liek tables, with a few additional modifications.

So, we have two tabular .tex files (assuming we write this one as well). Now what?

The final product

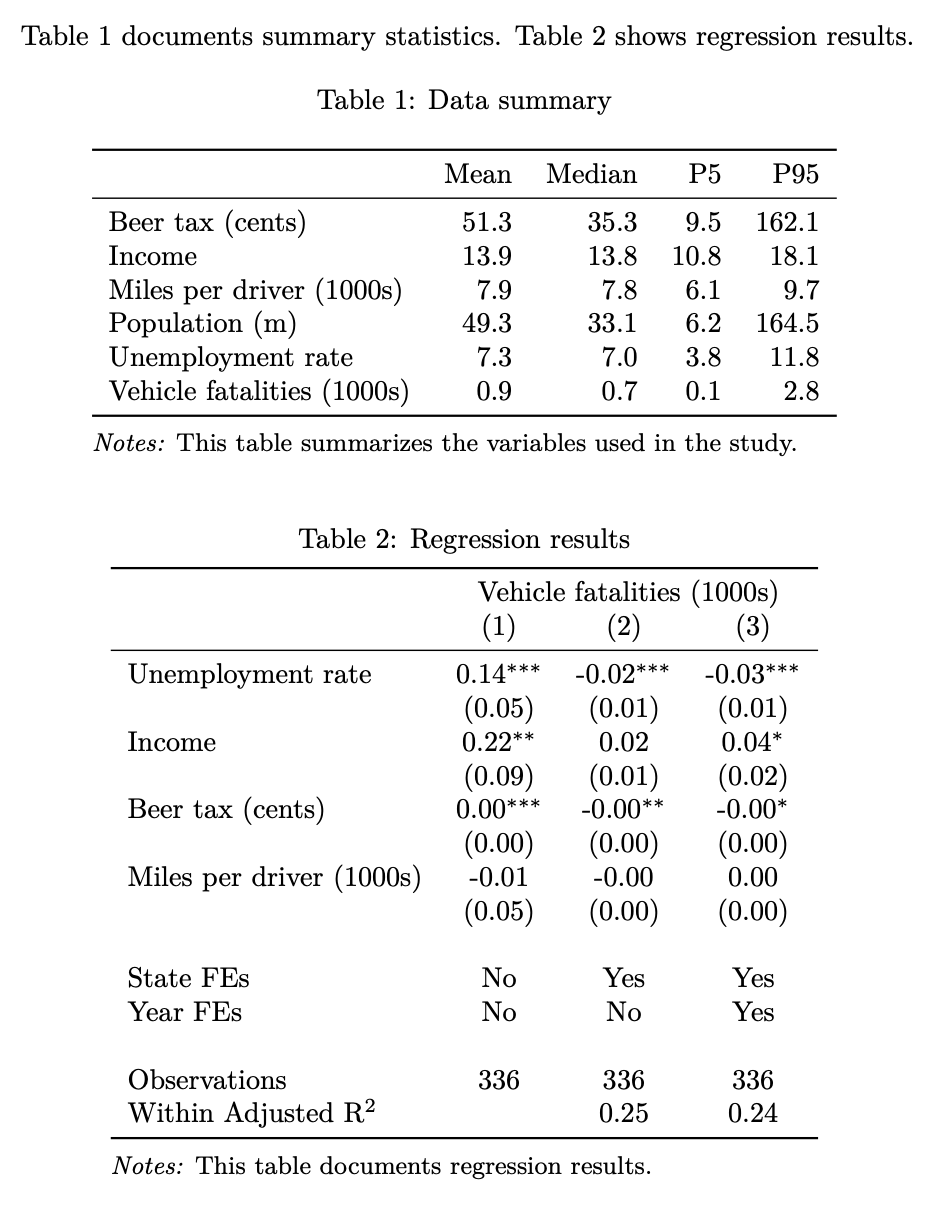
It’s time to put it all together! Below is a minimal “container” TeX code for these two tables, with sample captions and notes.

\documentclass{article}
\usepackage{threeparttable}
\usepackage{booktabs}
\usepackage[capitalise]{cleveref}

% Define a notes environment
\newenvironment{notes}[1][Notes]{\begin{minipage}[t]{\linewidth}\small{\itshape#1: }}{\end{minipage}}

\begin{document}

\cref{tab:summary} documents summary statistics. \cref{tab:regs} shows regression results.

\begin{table}[!h]
    \centering
    \begin{threeparttable}
        \caption{Data summary}
        \label{tab:summary}
        \input{summary.tex}
        \begin{notes}
        This table summarizes the variables used in the study.
        \end{notes}
    \end{threeparttable}
\end{table}

\begin{table}[!h]
    \centering
    \begin{threeparttable}
        \caption{Regression results}
        \label{tab:regs}
        \input{regs.tex}
        \begin{notes}
        This table documents regression results.
        \end{notes}
    \end{threeparttable}
\end{table}

\end{document}

And here’s a screenshot of what that looks like once compiled.

So… maybe there IS something a little sexy about tables?

Footnotes

  1. Alternatively, if you prefer not to rescale you may need to format each one as a string instead. This takes a bit more work.↩︎